


For this analysis, we examined public mineral deed records in 65 counties. The charts and maps below are powered by our data and analytics platform, Convey640, which uses advanced computer technology to gather, clean, and organize regulatory, land, and well data into a single software solution. This blog is meant to be informative and is not intended for investment advice. If you have any questions or would like to learn more about Convey640, please contact ctucker@convey640.com.
INTRO
In our 2019 overview, we ended the blog with the following statement, “The same companies have dominated the leaderboard over the past few years, and with the changing market, we may see some new companies at the top of next year’s list.” And that appears to have happened in 2020. Additionally, the amount of money spent in 2020 vs. 2019 was drastically less, an 84% drop when looking at the top 10 paying buyers. And the once highly sought after STACK mineral was not as attractive in 2020.
WHERE
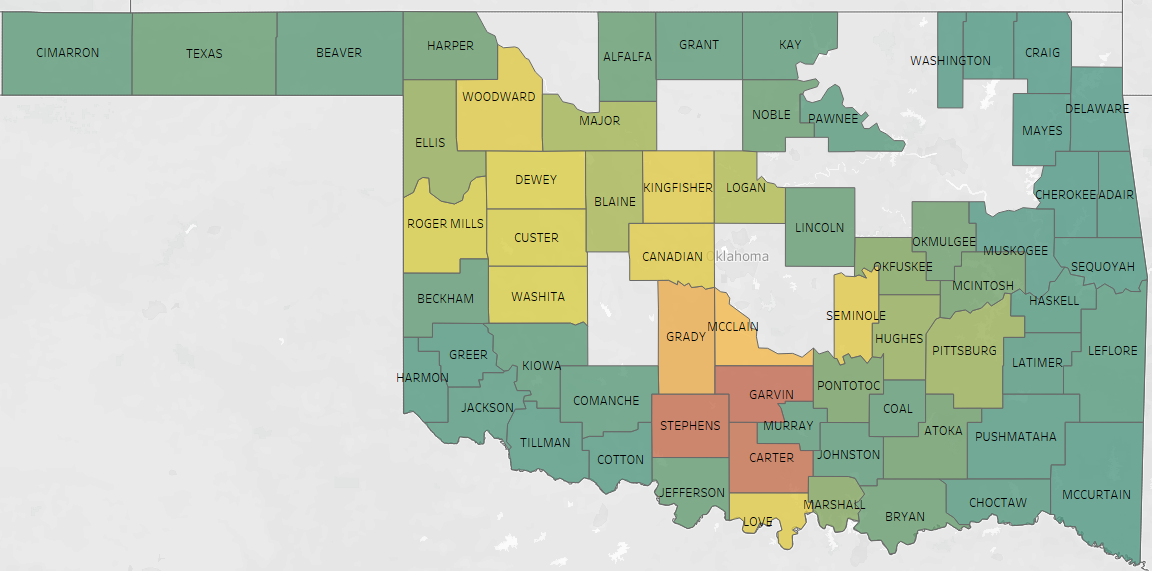
This year we upgraded our platform to pull in source data from 65 counties. This data is updated daily to ensure our clients have access to the most up-to-date information. As you can see by the map, Garvin, Carter, and Stephens Counties saw the most activity. And this makes sense if you think about family-type companies trying to buy cash flowing, PDP minerals. Additionally, the heavier funded groups, including mineral entities related to operators, are trying to buy ahead of the drill bit. These counties had numerous regulatory filings by Continental, 89 Energy, Ovintiv, and others, which signaled the possibility of new drilling.
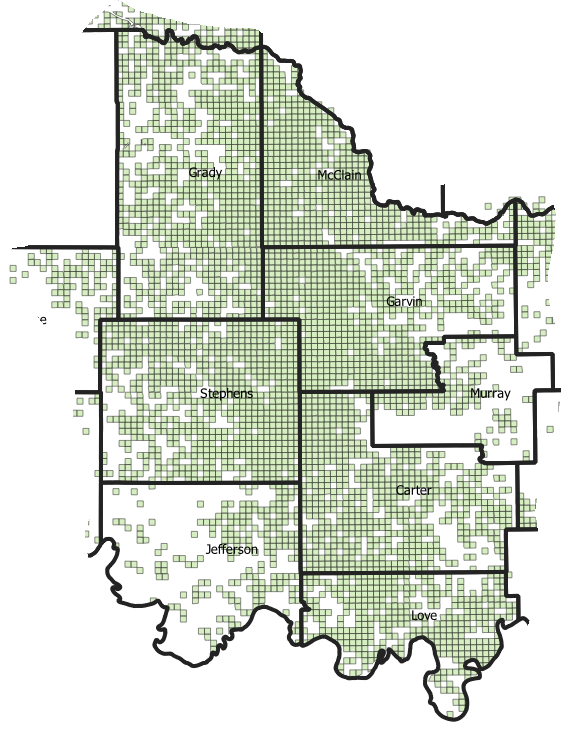
By exporting our data to a GIS program, we can map each Section for a more zoomed-in view. The below map shows very few sections untouched in the previous heat map’s red/orange counties. The ability to export 640 data and map acreage becomes extremely valuable when researching a competitor’s buy area or analyzing a potential acquisition target.
WHO
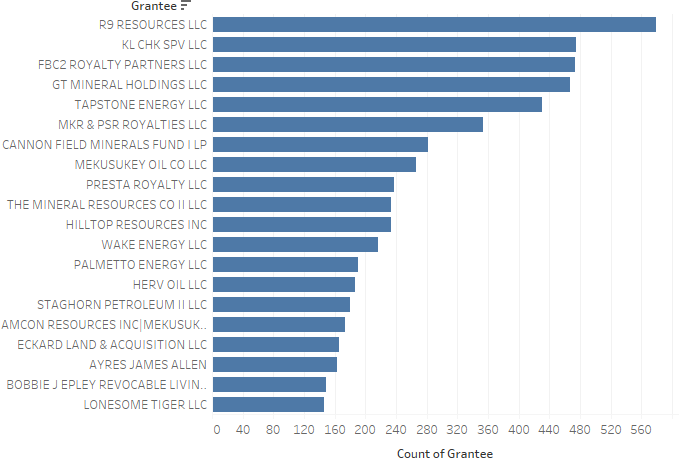
The Top 20 Grantees chart below is based on the number of tracts acquired, not net mineral acres. The list is comprised of smaller companies and trust, with a few exceptions. When you compare this chart to 2019, you can quickly notice the lack of private equity groups.
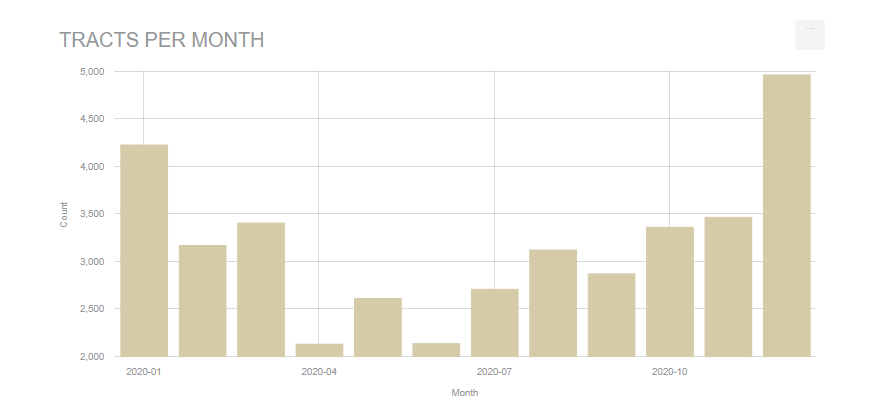
WHEN
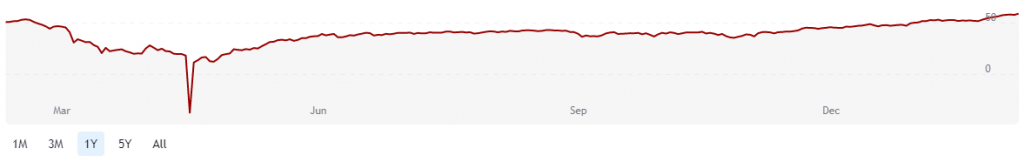
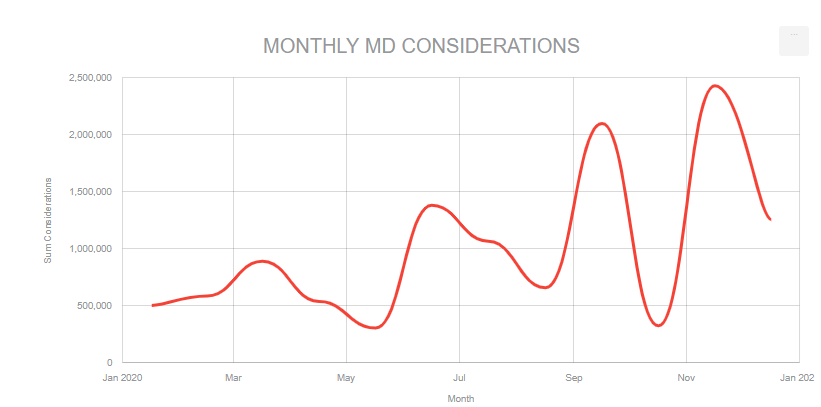
Spring of 2020 was for the record books…As we are all very aware, April 20 saw oil prices drop below zero for the first time in history. So it should be no surprise that the number of mineral tracts purchased during that same time also saw a drop. Although activity had already been trending down, it felt like overnight budgets were immediately turned off. Since we provide our subscribers the option of month-to-month plans, we too saw a pause in monthly renewals during this period. However, we are grateful that most of these customers returned and are happy to provide our clients with this flexibility.
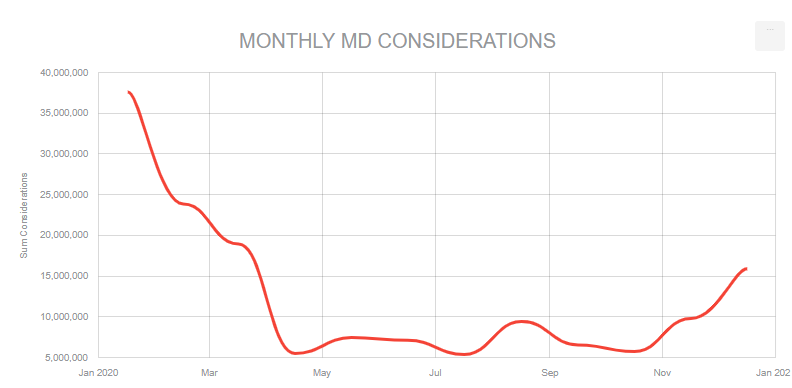
HOW MUCH
As mentioned in 2019, the number of tracts acquired throughout the year is not a great indicator of which companies are spending the most money. A 0.25 net mineral acre tract is counted the same as a 250 net mineral acre tract. Therefore, the amount of consideration recorded (i.e., Doc Stamp Calculation of 75 cents per $500) is a better indicator of who is actively investing in minerals. There a few new names on this list when compared to 2019.
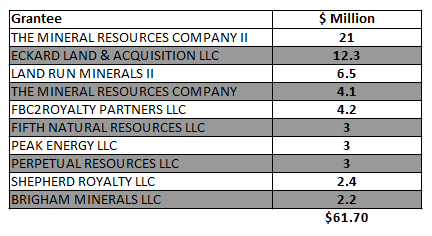
Total Consideration For 2020
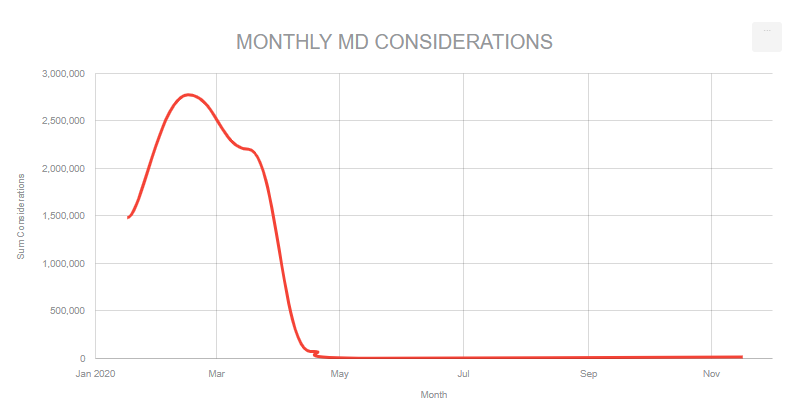
Almost all of their spending was at the first of the year.
Eckard stayed fairly active throughout all of 2020.
Like The Mineral Resources Company, Land Run was active at the start of the year and then appeared to cease mineral buying toward the end of Spring.
FBC2 entered into the leaderboard with a large acquisition in December 2020, acquiring assets from Northwest Royalty, LLC.
Acquired interest from Roan Holdings in January and February 2020 and had no other activity during the year’s remainder.
Consideration Per County
When we examine the consideration spent per county, Garvin remains the leader with $21.6 million, followed by Grady with 17.6 Million, and Love with $15.8 million. This further illustrates that STACK minerals are no longer driving the market.
CONCLUSION
As it has been said by many, 2020 was a challenging year for the oil and gas industry, especially for Oklahoma. Part of the blame can be directed toward Covid-19, but the industry was already facing challenges before the virus. Well results and returns presented to investors during the shale boom appear to have been overstated, creating a lack of trust. Additionally, Environmental, Social, and Governance (ESG) activities became buzzwords amongst investors. These events all contributed to funding leaving the space.
However, as we write this, Oklahoma, along with other parts of the country and world, are experiencing record cold temperatures. And many are finding out first hand that “green energy” is not as reliable in these conditions. Oil and gas provide affordable and reliable energy to millions worldwide and will continue to be a valuable commodity. Even Elon Musk admitted, ” I’m not in favor of demonizing the oil and gas industry. Because like we can’t stop instantaneously and not have oil and gas. You know, like, we’ll likely die of starvation basically. We’re going to need to burn fossil fuels for a long time—.”
So yes, 2020 was tough, and the landscape will likely look a little different moving forward. But the oil and gas industry is comprised of the brightest and most resilient individuals. We are excited to be a part of this great industry and are eager to see what 2021 brings.
INTERESTED IN MORE?
Schedule a demo to see how Convey640 can help you monitor your assets with alerts, analyze competitors, and discover acquisition opportunities.
Comments are closed